6 interesting things we’ve learned about the 2017/18 Premier League using expected goals (xG)
It can’t tell us everything, but the much-discussed analytical model is certainly interesting enough to draw some conclusions from

Expected goals (xG) has sparked controversy ever since it hit the mainstream on Match of the Day at the beginning of the 2017/18 season, but the debate on social media was kicked up a notch this week.
Jeff Stelling’s anti-xG rant on Soccer Saturday has retriggered a culture war between the ‘geeks’ and Proper Football Men
Jeff Stelling’s anti-xG rant on Soccer Saturday has retriggered a culture war between the ‘geeks’ and Proper Football Men; a seemingly endless argument between those who enjoy using analytics to inform their interpretation of the game, and those who believe number-crunching threatens to undermine the sport’s pure joy.
Either way, the value of this statistic shouldn’t threaten Jeff Stelling or anyone else – as FourFourTwo discovered. Expected goals is a useful analytical tool which helps to illuminate the quality of any given chance but, like any statistic, it is meaningless without interpretation and analysis that comes from watching games with your own eyes. David Sumpter, author of Soccermatics, explains its usage nicely in his book:
A few people have been asking for an idiot proof explanation of Expected Goals. In Soccermatics, I wrote one for Tim Sherwood. pic.twitter.com/1giiJPSyUi
— David Sumpter (@Soccermatics) November 23, 2017
With that in mind, here are six Premier League trends that xG, taken from understat.com, has helped to illuminate:
1. Chelsea have relied on individual moments of magic during sticky patch
The best features, fun and footballing quizzes, straight to your inbox every week.
Chelsea’s xG for the season so far is 15.44, which is 7.56 lower than their actual tally of 23 goals. This indicates that Antonio Conte’s side have been scoring goals from shots that are typically unlikely to find the back of the net.
It’s clear that things would have gone a lot worse for Conte had their star players not come good with individual moments of brilliance
The Blues have begun to hit consistent form over the last few weeks, but ever since their 3-2 defeat to Burnley on the opening day they have found it difficult to fashion good quality chances on a regular basis. Looking at the xG stats, it’s clear that things would have gone a lot worse for Conte had their star players not come good with individual moments of brilliance.
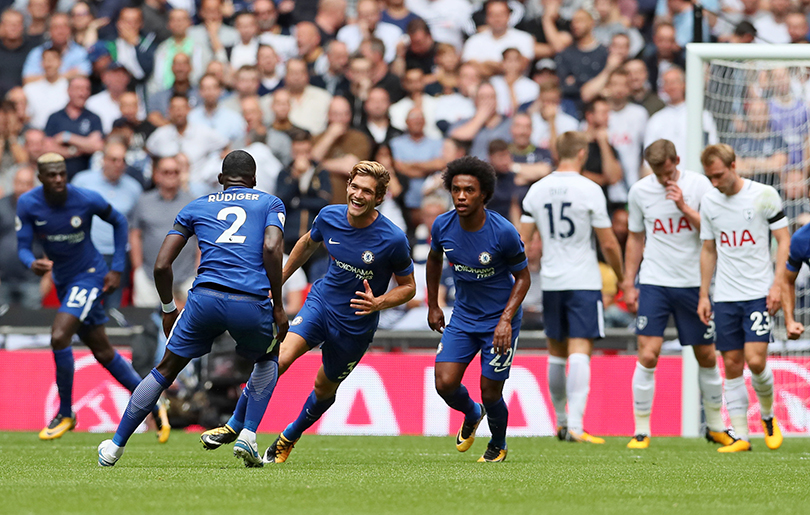
Marcos Alonso’s magnificent free-kick at Tottenham on matchday two played a crucial role in Chelsea’s victory at Wembley; N’Golo Kante’s 25-yard daisy-cutter proved to be the winning goal at Leicester; and Pedro’s brilliant curling effort gave Chelsea the lead in their 4-2 win over Watford at a time when Marco Silva’s side were on top.

One possible interpretation of this xG data is that Conte’s new 3-5-1-1 formation has too many defensive positions, and thus is overly reliant on individuality for goalscoring – although it’s far too early in the season to argue this theory convincingly.
2. Poor finishing has cost Crystal Palace dearly
The club with the biggest difference between their xG, xGA (expected goals against) and xP (expected points) and real events is Crystal Palace. The Eagles have scored 9.63 fewer goals than xG predicted and conceded 3.4 more, giving them 11.30 fewer points than “expected” by this analytic tool.
Palace fans can rightly point to key misses as the root cause of their problems this season, and while performances have been poor their xP suggests things haven’t been quite as awful as the league table makes them out to be.
Goalless Christian Benteke is statistically the most profligate finisher (his xG is 2.13), which confirms what we have witnessed on the pitch:
monsalvo: Benteke. Error. NBC Sports Ne… Premier League Soccer: Liverpool vs. Crystal Palace https://t.co/nN6MfF82SYpic.twitter.com/8BvPSQ2J0N
— FanSportsClips (@FanSportsClips) August 19, 2017
Undoubtedly, the best use of expected goals is predicting future events: achieving better xG numbers than the actual scoreline suggests that performances are good – even if results aren’t. Consequently, the disparity between Palace’s real points tally of five and their “expected points” tally of 16.3 is an encouraging sign for Roy Hodgson.
3. Manchester City’s coaching helps them score the half-chances
Practicing the same moves over and over – plus knowing instinctively where your team-mates will be – means City are unusually prepared for the half-chances that crop up
A chasm between actual goals and expected goals doesn’t always mean teams have got lucky, or that they are overly reliant on long-range strikes. In the case of Man City, who have netted 5.86 more times than expected, this is merely a mark of their strength in all areas of attack.
Pep Guardiola’s meticulous coaching creates overloads in key areas of the final third, which is increasing City’s overall chance creation – but more importantly, is increasing their ability to score from unlikely situations. Practising the same moves over and over – plus knowing instinctively where your team-mates will be – means City are unusually prepared for the half-chances that crop up in the penalty area.
Far from being lucky, Guardiola’s team are maximising their shooting opportunities to steamroll the opposition.

4. xG for individuals helps reveal best and worst finishers in the division
Since xG indicates the likelihood of scoring any given chance, we can anticipate that good finishers will have netted more times than their “expected” amount.
This is the case for every Premier League player in the top 10 of the goalscoring charts this season bar Romelu Lukaku, whose xG is 0.89 higher than his real tally. The Belgian’s run of seven matches in all competitions without a goal included some surprising misses.
Alvaro Morata, Leroy Sane and Anthony Martial all have xG stats to suggest they are unusually good at scoring difficult chances
Alvaro Morata, Leroy Sane and Anthony Martial all have xG stats to suggest they are unusually good at scoring difficult chances, while David Silva sits at the bottom of the xG pile having netted almost three fewer goals than “expected”.
Obviously these numbers shouldn’t be given too much prominence, but in many ways they conform to our expectations. Silva often snatches at his shots, but Morata, Sane and Martial have established themselves as deadly marksmen from all angles this season.
Other notable players include Abdoulaye Doucoure (who has scored several long-range goals this season) and Benteke (see above).
5. Opposition class at key moments has cost Leicester promising start to the season
Leicester’s results in 2017/18 under Craig Shakespeare never felt quite right. Performances were mostly confident and the squad looked cohesive, so why couldn’t they win matches? Interpreting their xG stats for the season offers some kind of an explanation.
The Foxes like to press fairly high up the pitch, hunting the ball in packs before launching their quick counter-attacks via Jamie Vardy. However, when facing bigger teams they can’t afford to be so bold, which on occasion has led to some surprisingly wayward defending as they press the ball.

Leicester have won 5.25 points fewer than “expected”, thanks largely to two matches in particular:
Leicester 2-3 Liverpool (xG: Leicester 3.04 – 1.94 Liverpool)
Leicester 1-2 Chelsea (xG Leicester 1.35 – 1.04 Chelsea)
Had defending been better, Leicester could have earned at least four more points from these two games, turning an average Premier League start into a good one.
And who knows, maybe positive results in these two matches would have inspired more than two draws against Bournemouth and West Brom – the final two outings before Shakespeare was dismissed.
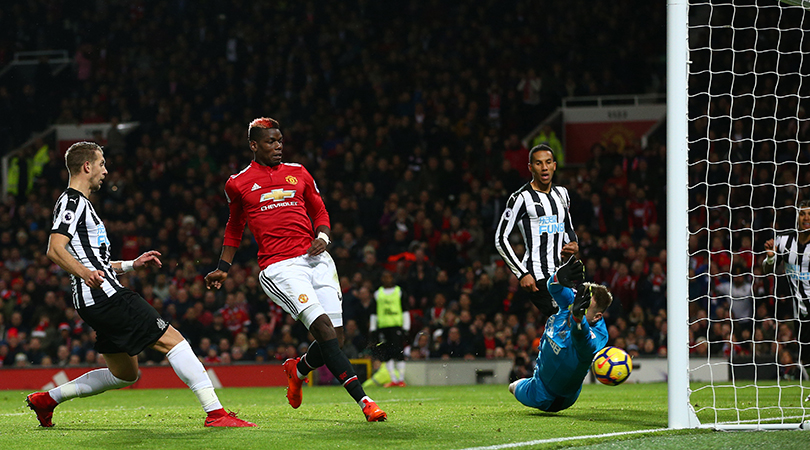
6. Manchester United have badly missed Paul Pogba
Since xG takes into account the position of a shot, the body part used to take it and the proximity of defenders, it’s very useful in illuminating just how good Pogba’s deliveries have been for Manchester United this season. They lost the xG battle in each of their last four outings before beating Newcastle.
United have won 13 points from five league matches in which Pogba has featured this season, and the Frenchman plays more key passes (2.2 per match) than any other player at the club.
These statistics already suggest his importance to chance creation, but the sudden change in their xG is further evidence of his ability to change the dynamic of a game.

